

Changelog
- Added option to retrieve GFS MOS data for forecast infographic by @crhowell3 in #35
- Added version tags to infographics by @crhowell3 in #35
- Bump typescript-eslint from 8.25.0 to 8.26.1 by @dependabot in #37
- Created form for manually inputting forecast data by @crhowell3 in #40
- Deprecated and removed YAML config file by @crhowell3 in #40
- Overhauled Threatcast form and display UI by @crhowell3 in #42
- Forecast form data now updates when querying MOS data by @crhowell3 in #44
Synopsis
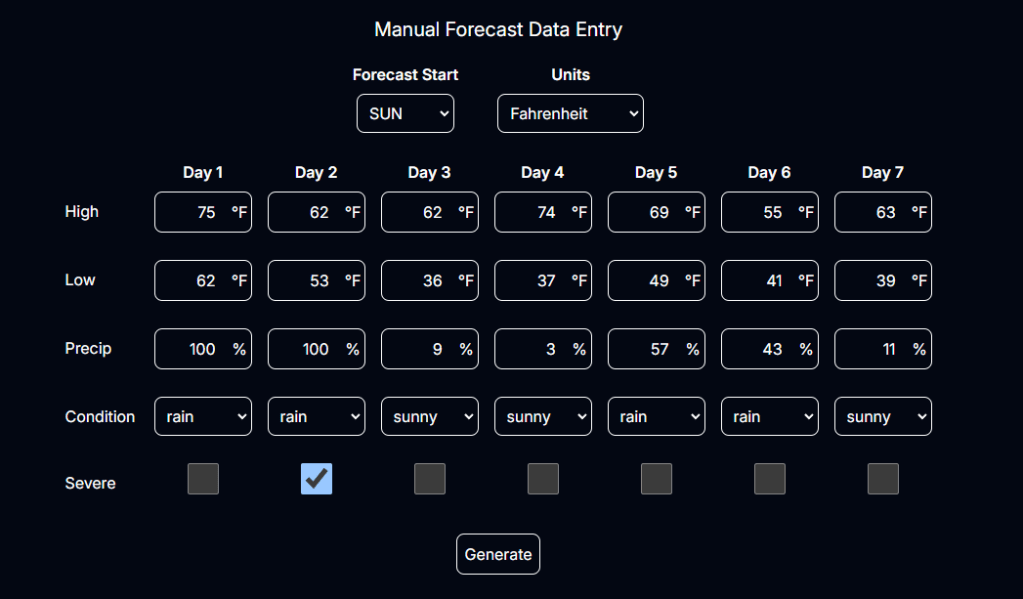
This version of static-wx includes some UI/UX changes as well as some new features. The biggest changes pertain to the generation of the forecast infographic. YAML configuration files are no longer supported in favor of more dynamic data entry. Users have two ways of creating forecast charts: 1) via manual data entry in the new forecast data form, and 2) by querying the 00z or 12z GFS MOS public data via HTTP GET. There is now a form above the forecast infographic that has fields for all corresponding forecast variables. Once the form has been filled out, the user can press “Generate” to update the forecast infographic with the data in the field.
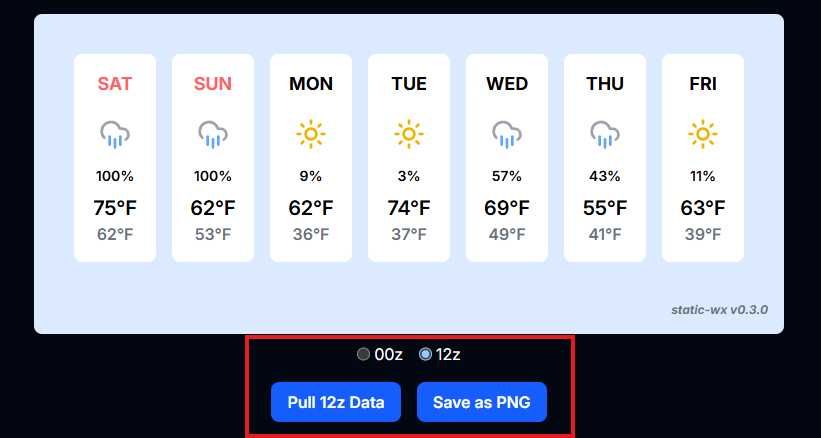
Alternatively, there is a button below the forecast infographic for performing an HTTP GET request to the GFS MOS data; this pulls down the data from KHSV (Huntsville, AL) and auto-populates the infographic with everything that it can from the data retrieved. Why only KHSV? Well, that was the easiest and most relevant for me to implement, but I am planning on adding an option for querying any station available in the GFS MOS. Expect that to arrive in v0.3.1.
Similarly, the Threatcast UI has been given a facelift. Previously, the data entry form was somewhat integrated into the infographic space, and it just looked a little awkward from an organization standpoint. That has since been cleaned up, and the form is now residing above the infographic as shown in the image below.
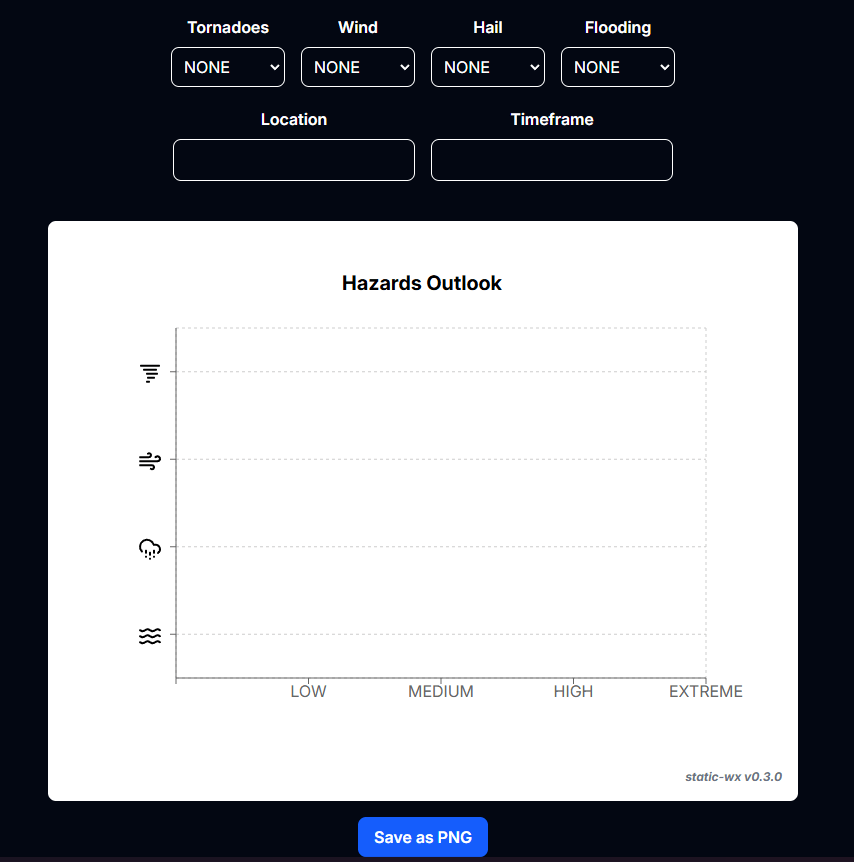
New data fields have been added to the Threatcast form as well. There are two new fields: Location and Timeframe. If left blank, the infographic looks as it does above. If filled out, though, it resembles what is shown in the image below.
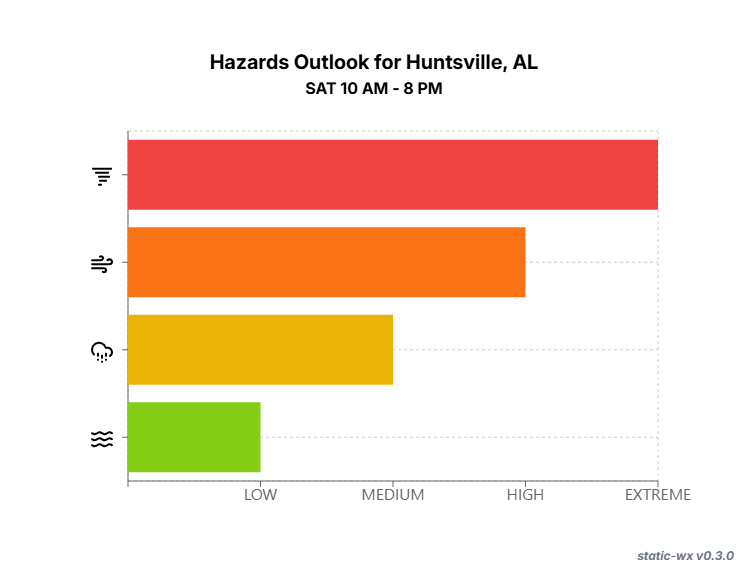
Notice the change to the infographic’s title as well as the addition of a subtitle. This is just another customization option that allows charts to convey more specific data, especially in relation to time and location. Something similar should also be arriving in v0.3.1 for the forecast infographic so that it can be traced back to a specific location if needed.
The last two changes are relatively minor. I added a small tag to the bottom right corner of the infographics that displays the name of the application and the version that was used to generate the charts. And finally, the trusty Dependabot bumped the typescript-eslint version.
That’s it for v0.3.0! I will work on the changes that I discussed for v0.3.1, and once that is ready, I will cut a release and publish a changelog here. Until next time…
